2020-Present
Digital Experience Monitoring
Digital Experience Monitoring, or DEM, covers the end user monitoring and business correlation components of the AppD product. As the Senior Director of Product Management, I led a multi-level organization of PMs from day to day, helped launch transformative features, created a unified and forward-looking strategy and roadmap, and increased recurring revenue over several years.
MY ROLES
Product Management, Strategy, Prioritization, Team Leadership
COMPANY
AppDynamics (Cisco)
In Service of the Product and Team
After my transition to Product Management at AppDynamics, I gradually built up a portfolio of products and got promoted several times to Senior Director. Starting with the Dashboarding and Mobile App of AppDynamics, I acquired teams for the Analytics, Business Intelligence (BiQ), and End User Monitoring (EUM) parts of the product. They are alphabet soup, I know, but these are all critical components of AppD and help separate it from competitors. They trace the performance of a company's web-based and mobile applications all the way back to the impact they have on the bottom line metrics of a company, such as sales revenue. Imagine the Amazon $300 million button. Subtle changes to user experience—and especially crashes or confusing workflows—can make or break a company's success.
As I brought in teams of Product Managers to my organization, I saw the similarities and synergies between their parts of the product. But they had never been joined together in the past. This separation did not make sense to me: why couldn't one of our customers see the direct business impact, in one view, of their apps as their users tapped and clicked through their purchase workflows and flight booking pages? So I pushed my team to help in constructing a unified roadmap. We named this portfolio Digital Experience Monitoring, or DEM. This is also the label that Gartner and other industry analysts used as they spoke of IT opportunities for major companies in the future. This realignment set us up for success.
As for my team, I worked on the team dynamics and found ways to bring everybody together in new ways. We shared knowledge between each other via weekly team meetings. We worked on design and discovery of new initiatives together, within one roadmap, and shared strategies with each other. We built up a product telemetry system to measure conversion and retention of our own product using Segment and Amplitude. I led roadmap planning for the organization and instituted a common roadmap format that could be translated across all of DEM, using a weighting system known as RICE.
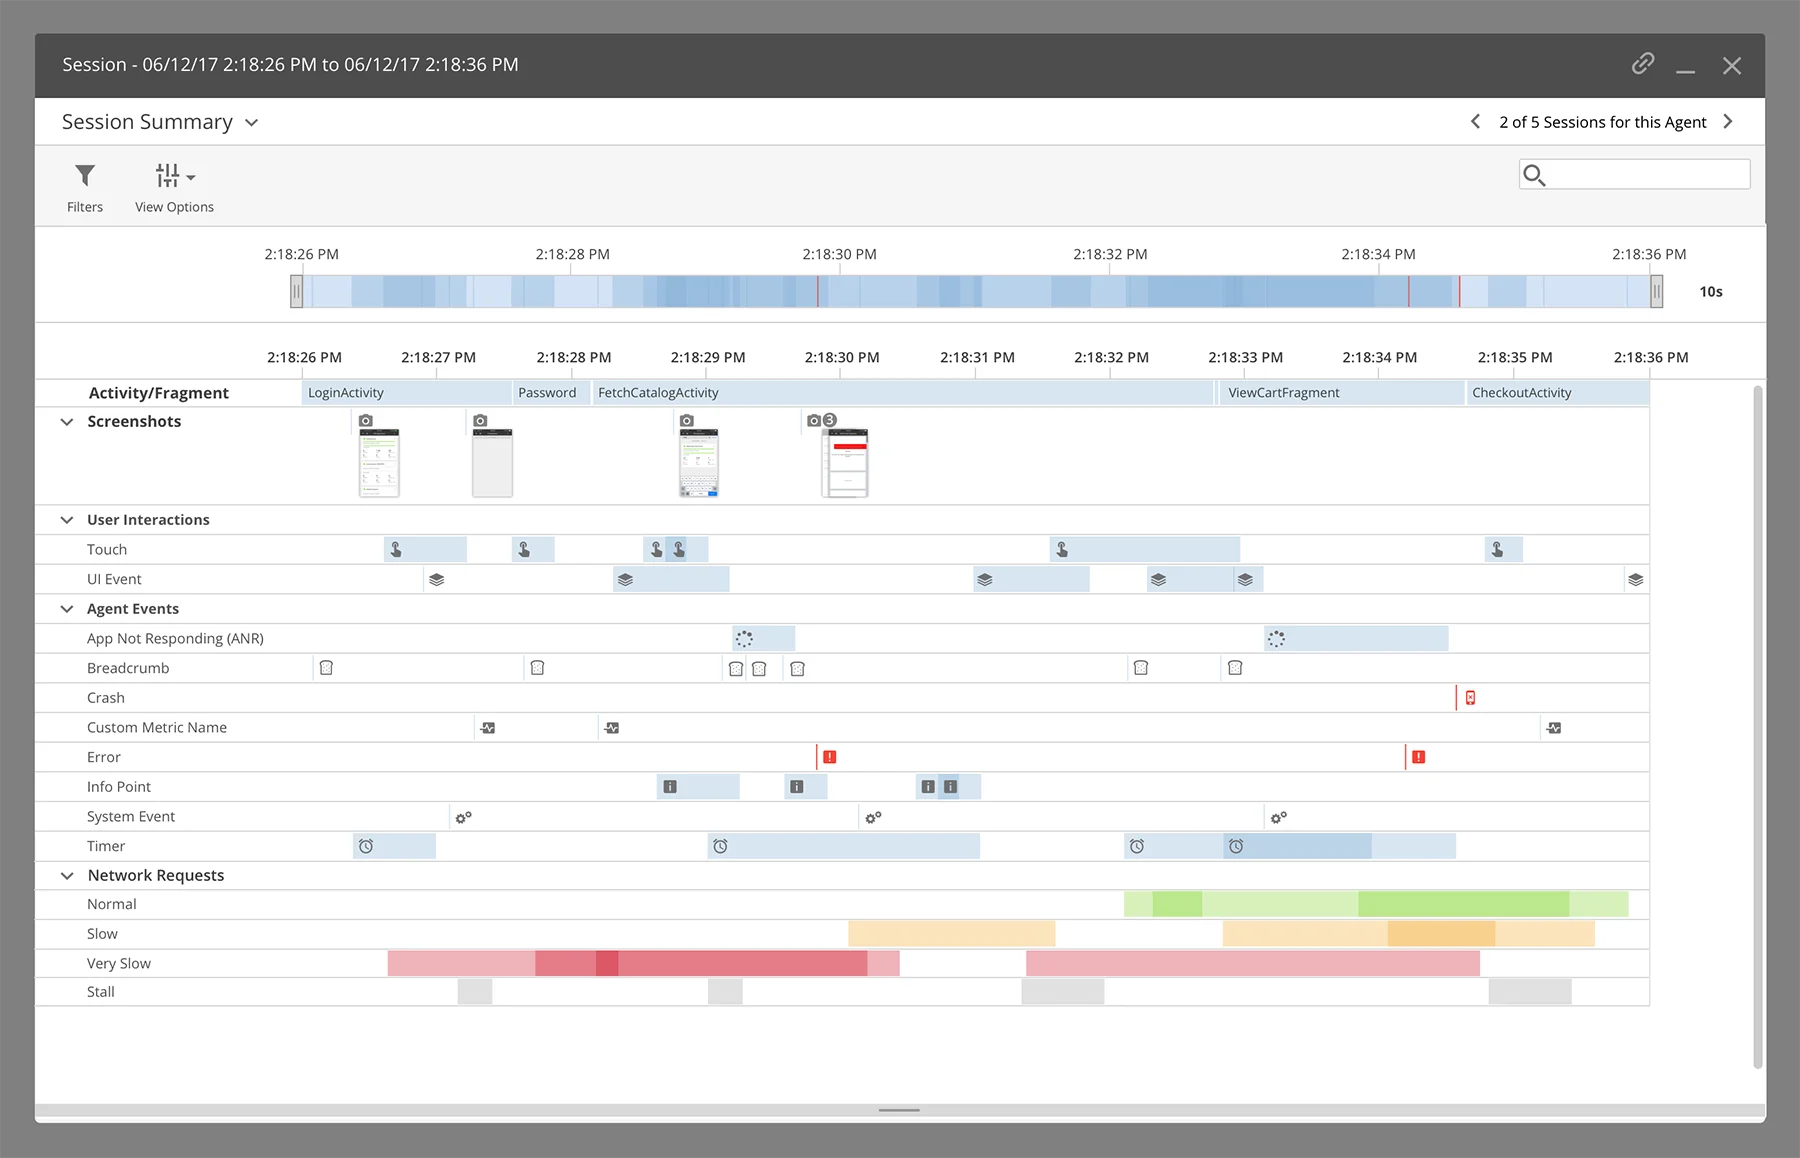
The Mobile Sessions display a series of timelines with a bunch of complex information about things that happen with a mobile app: performance, crashes, errors, user interactions, and other elements.
(Fun fact: my first role at AppD was Product Designer. I designed this capability and worked with Engineering to ship it.)
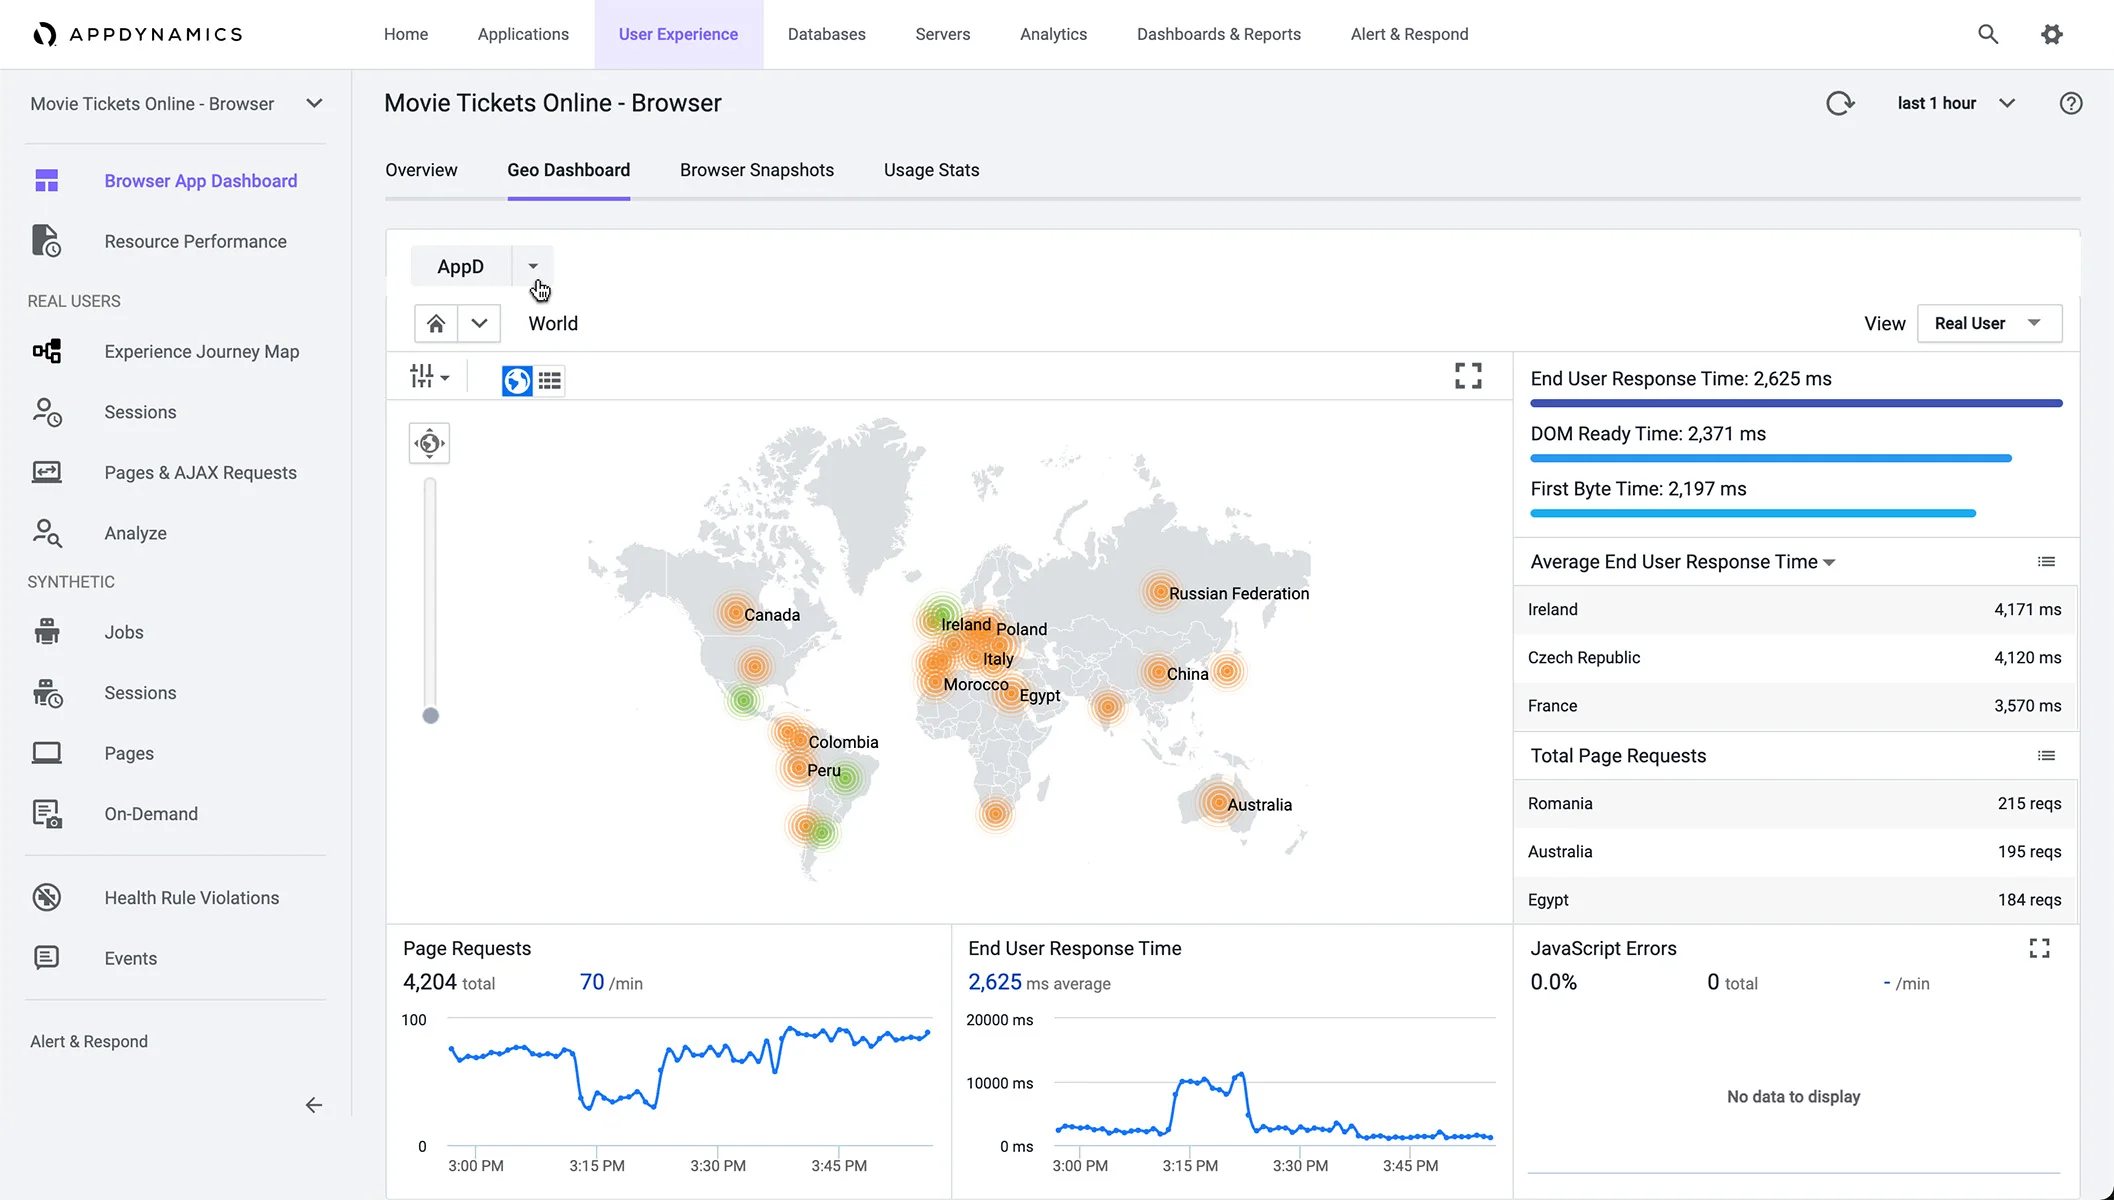
Experience Journey Map
One key initiative underway as I brought together DEM under one banner was the Experience Journey Map, or ExJM. The journey map was constructed using a proprietary Machine Learning-powered technology that showed complex user paths through a customer's application. Our competitors, at the time, had nothing like it. Swathi, a PM within my org, led the project. She was encountering some challenges with Design and Engineering resourcing to get the beta of the product to launch. I could see that customers were already lining up to use the journey map capability. I was able to get some additional resourcing for Swathi to do a redesign of ExJM with new visuals and interaction patterns, as well as some dedicated engineers to bring it to the finish line.
The Experience Journey Map aggregates all common user paths through an application into an integrated diagram and overlays user dropoffs and conversions over the top.
ExJM launched in 2019, and became one of our signature capabilities of the DEM suite. It remains one of my proudest moments as the leader of the organization. Within a few weeks, it was in use by dozens of large enterprise customers, and user retention of the feature remained above 80% for months after launch, in no small part thanks to Swathi's dedication. I worked to ensure she was recognized for her work.
Managing BiQ and Analytics
For a period of about six months, I also served as the Product Manager for the Business Intelligence (BiQ) and Analytics products. I believe strongly in having a present PM for any product team. That means participating in agile ceremonies, including planning, demos, and retrospectives. It means sitting with engineers to answer questions and problem solve as constraints arise. The team also needs to be able to understand the product roadmap. While I was working to hire a good PM for this role, I demonstrated this as best I could while balancing the asks of my time from my larger role as Senior Director.
This was a great way of remaining close to the product. I worked with the team to roll out a few projects that had already been in development, including a revamped administrative area that would provide recommendations for the most suitable configurations of our complex product. The team also built out a redesigned, more intelligent conversion funnel project that made it easier to generate funnels of the core business metrics for a large enterprise and track them in relation to the performance of their applications. I worked in a multidisciplinary team of designers, engineers, program managers, and researchers to launch the feature. I also grew out a crucial capability to connect the BiQ product with SAP, which was used by some of our largest customers for mission-critical applications. This remains one of the leading areas of recurring revenue growth for AppDynamics and enjoyed blockbuster sales quarters right out of the gate.
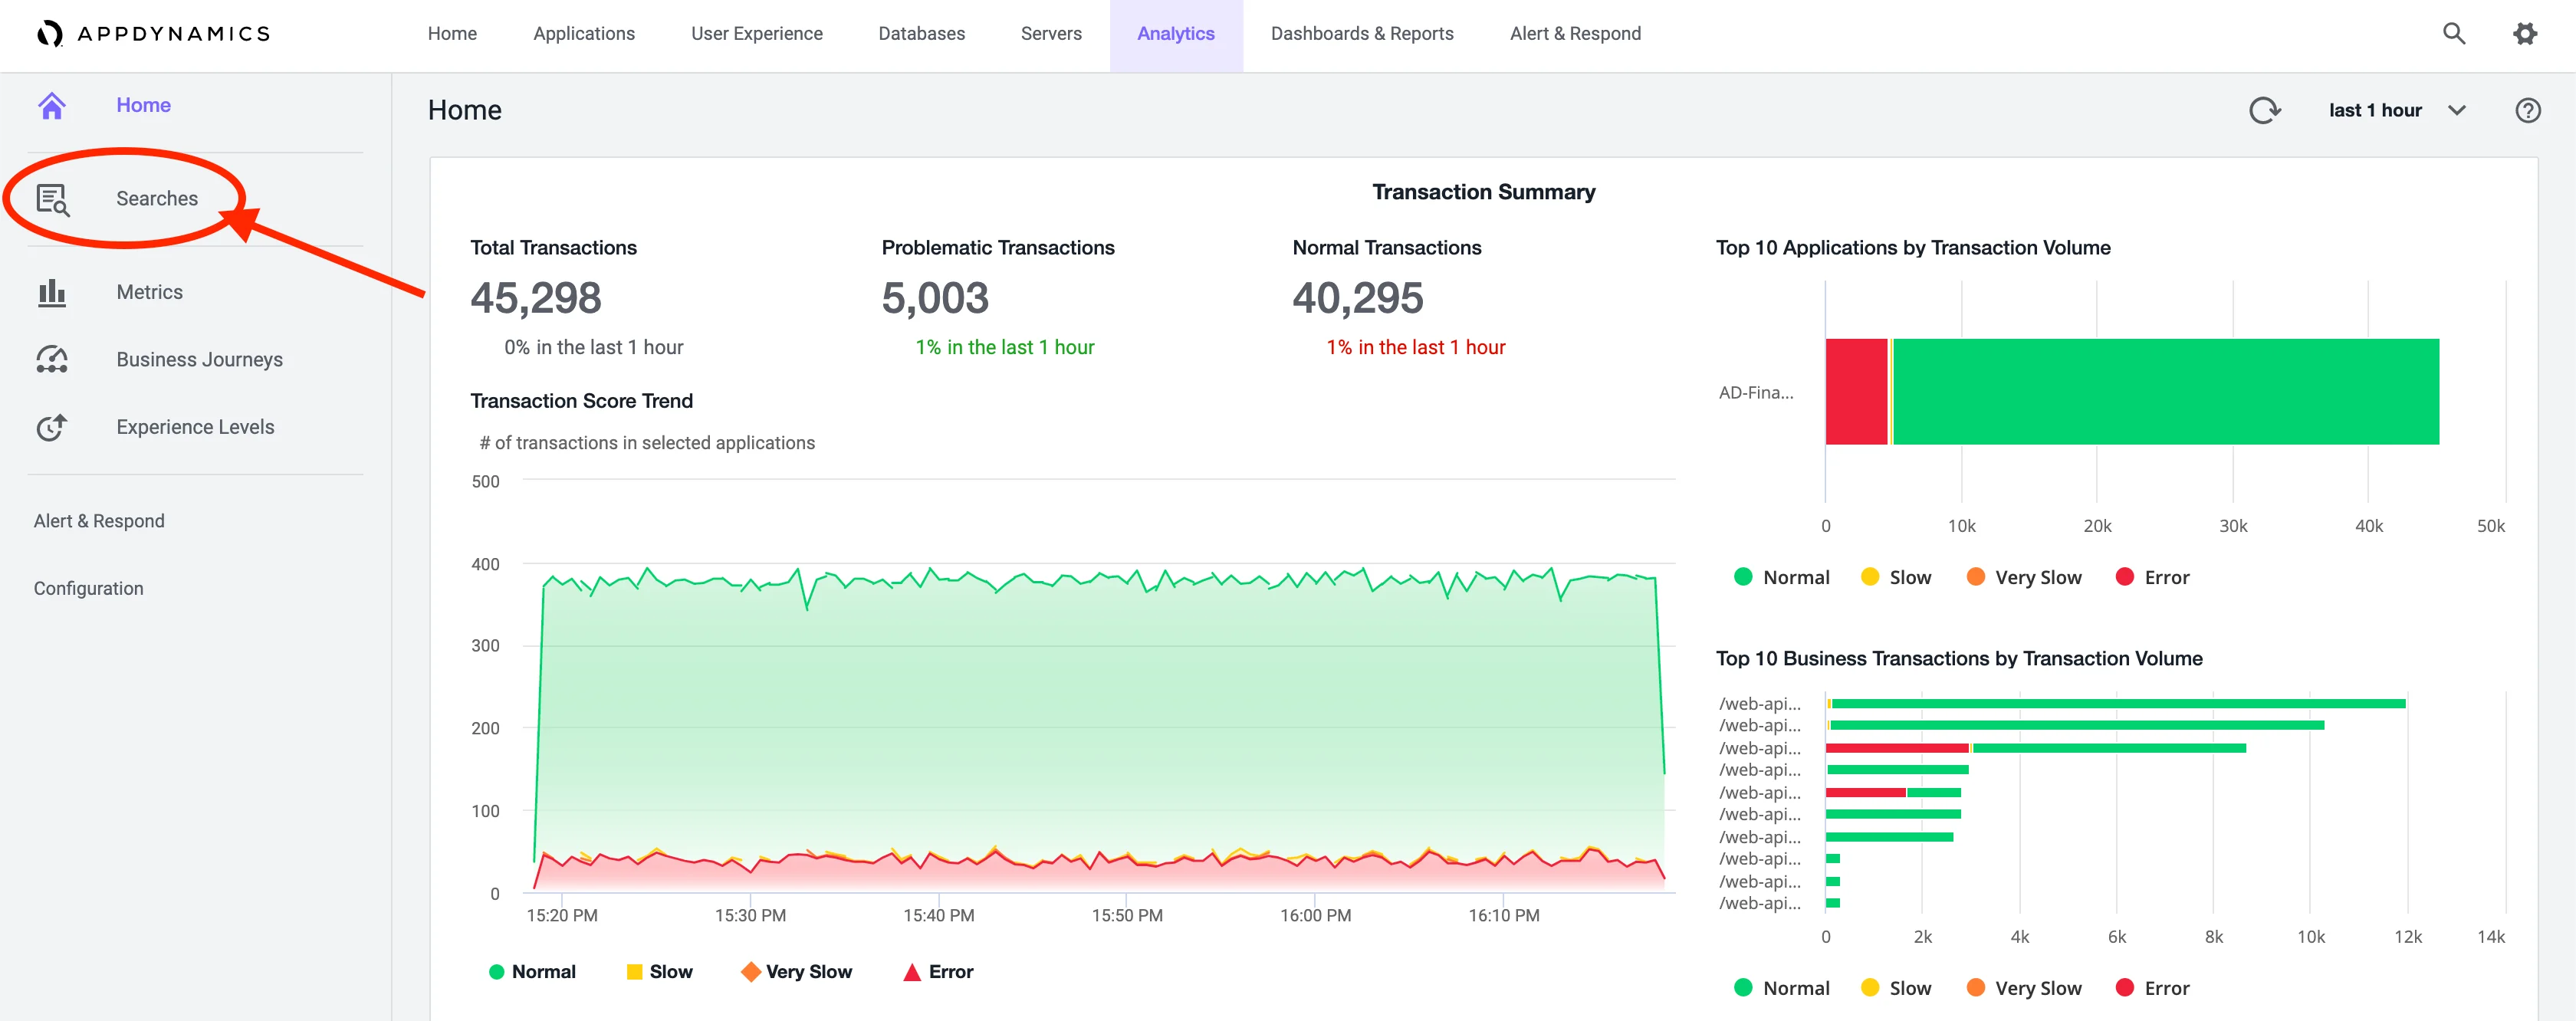
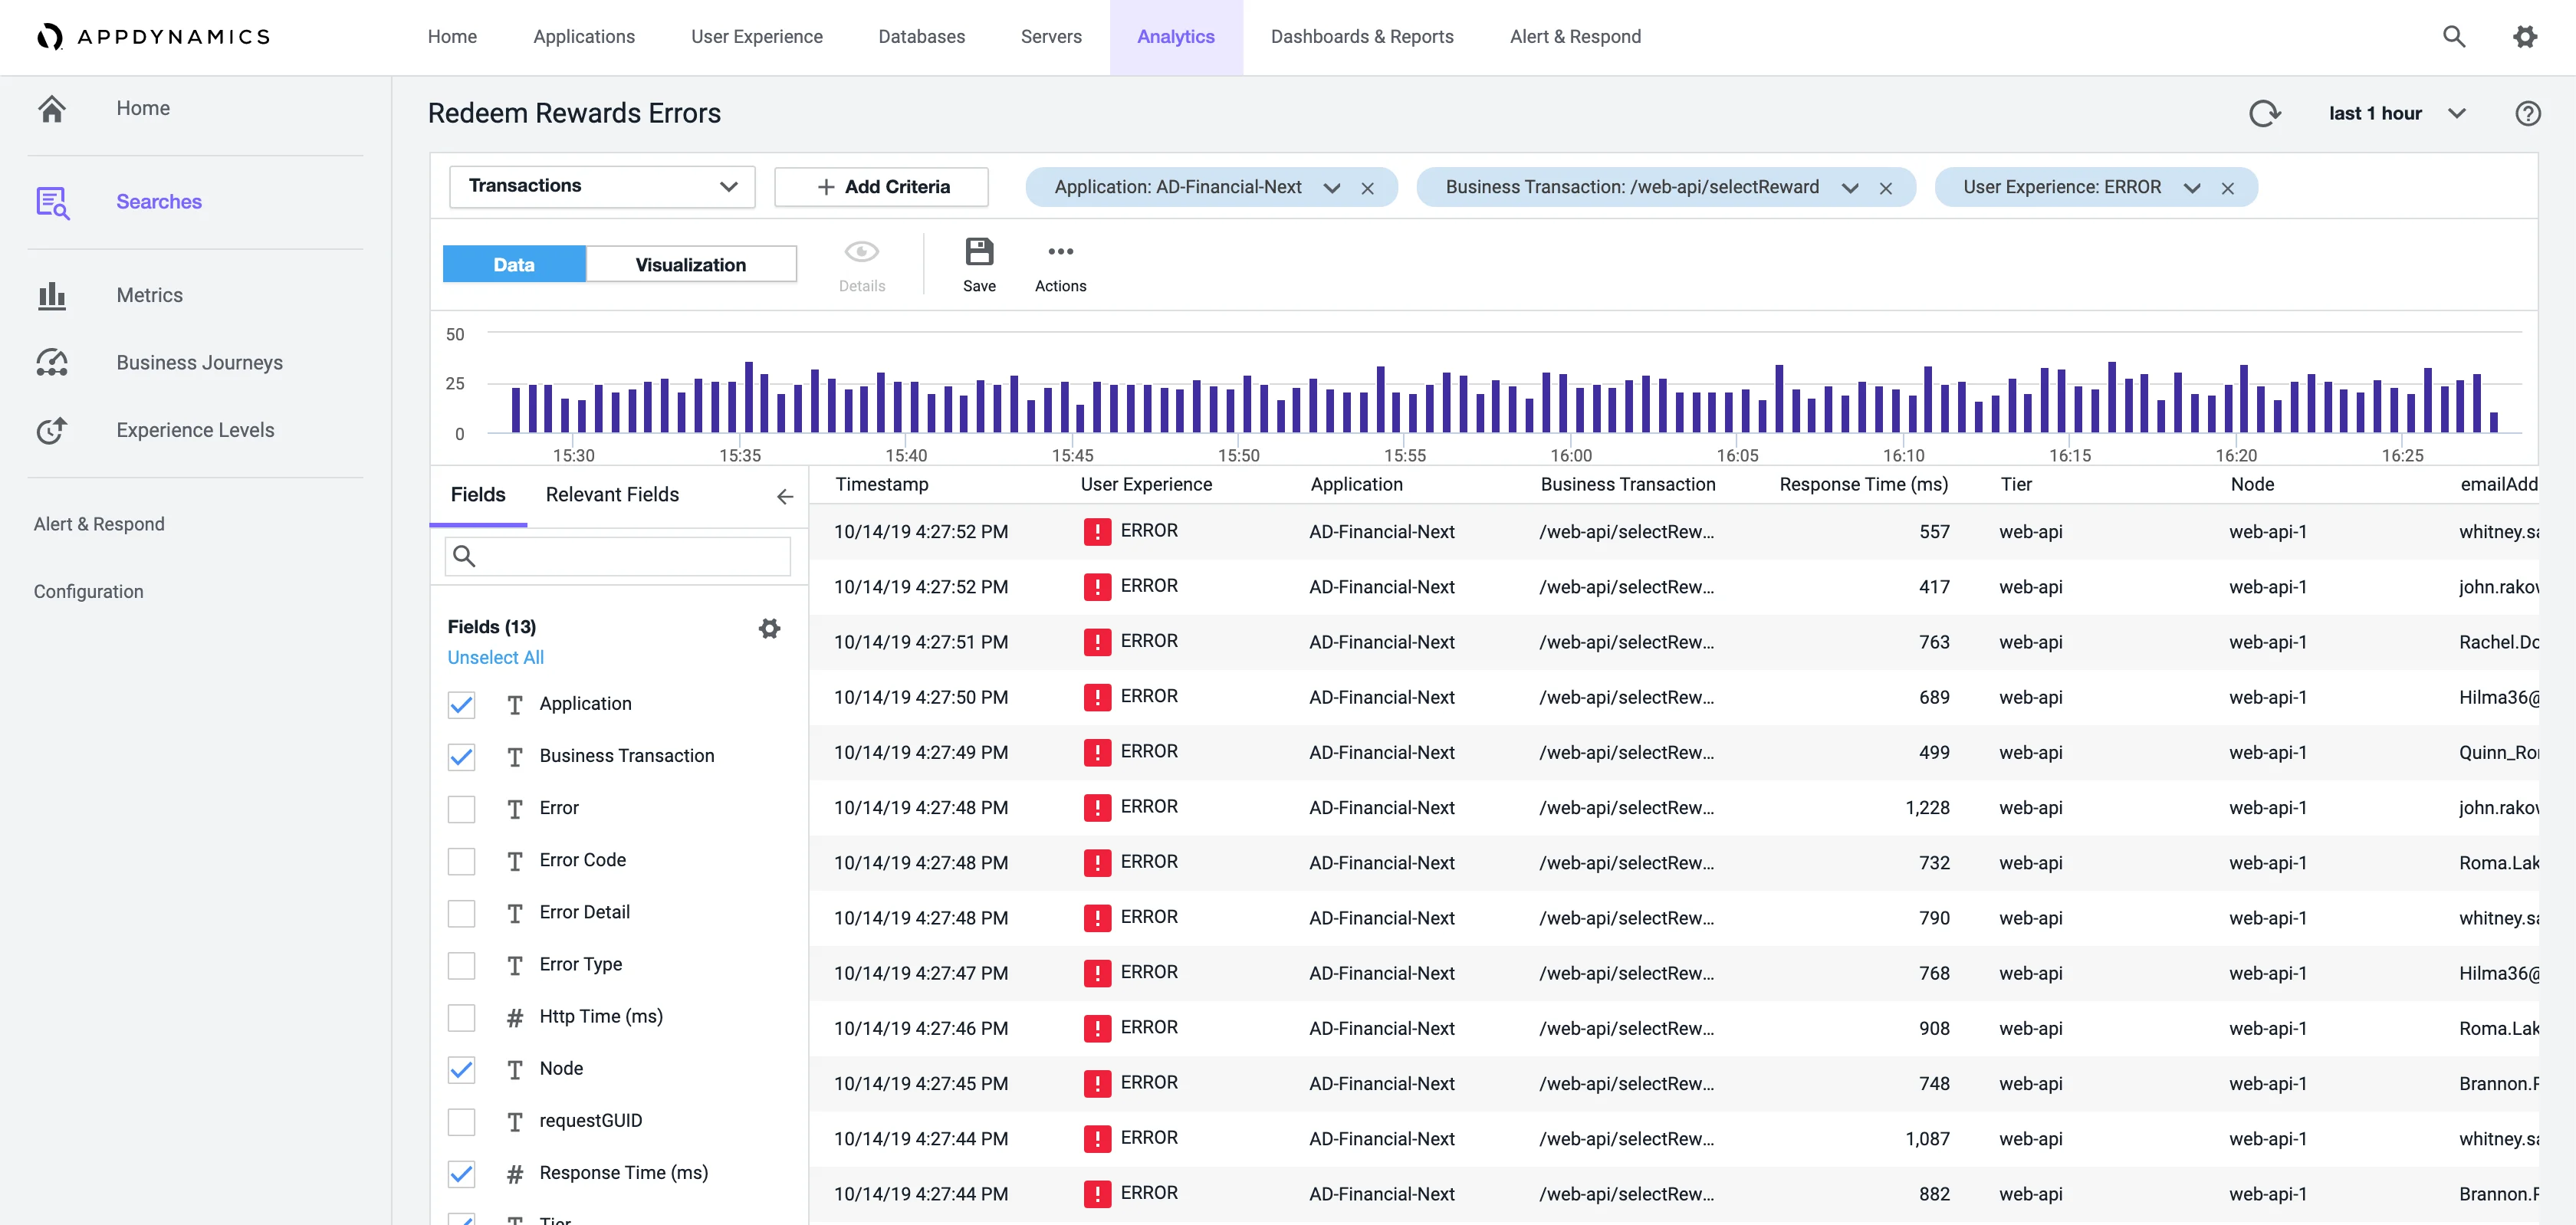
AppD Analytics allows users to build complex business queries and show the results on custom dashboards.
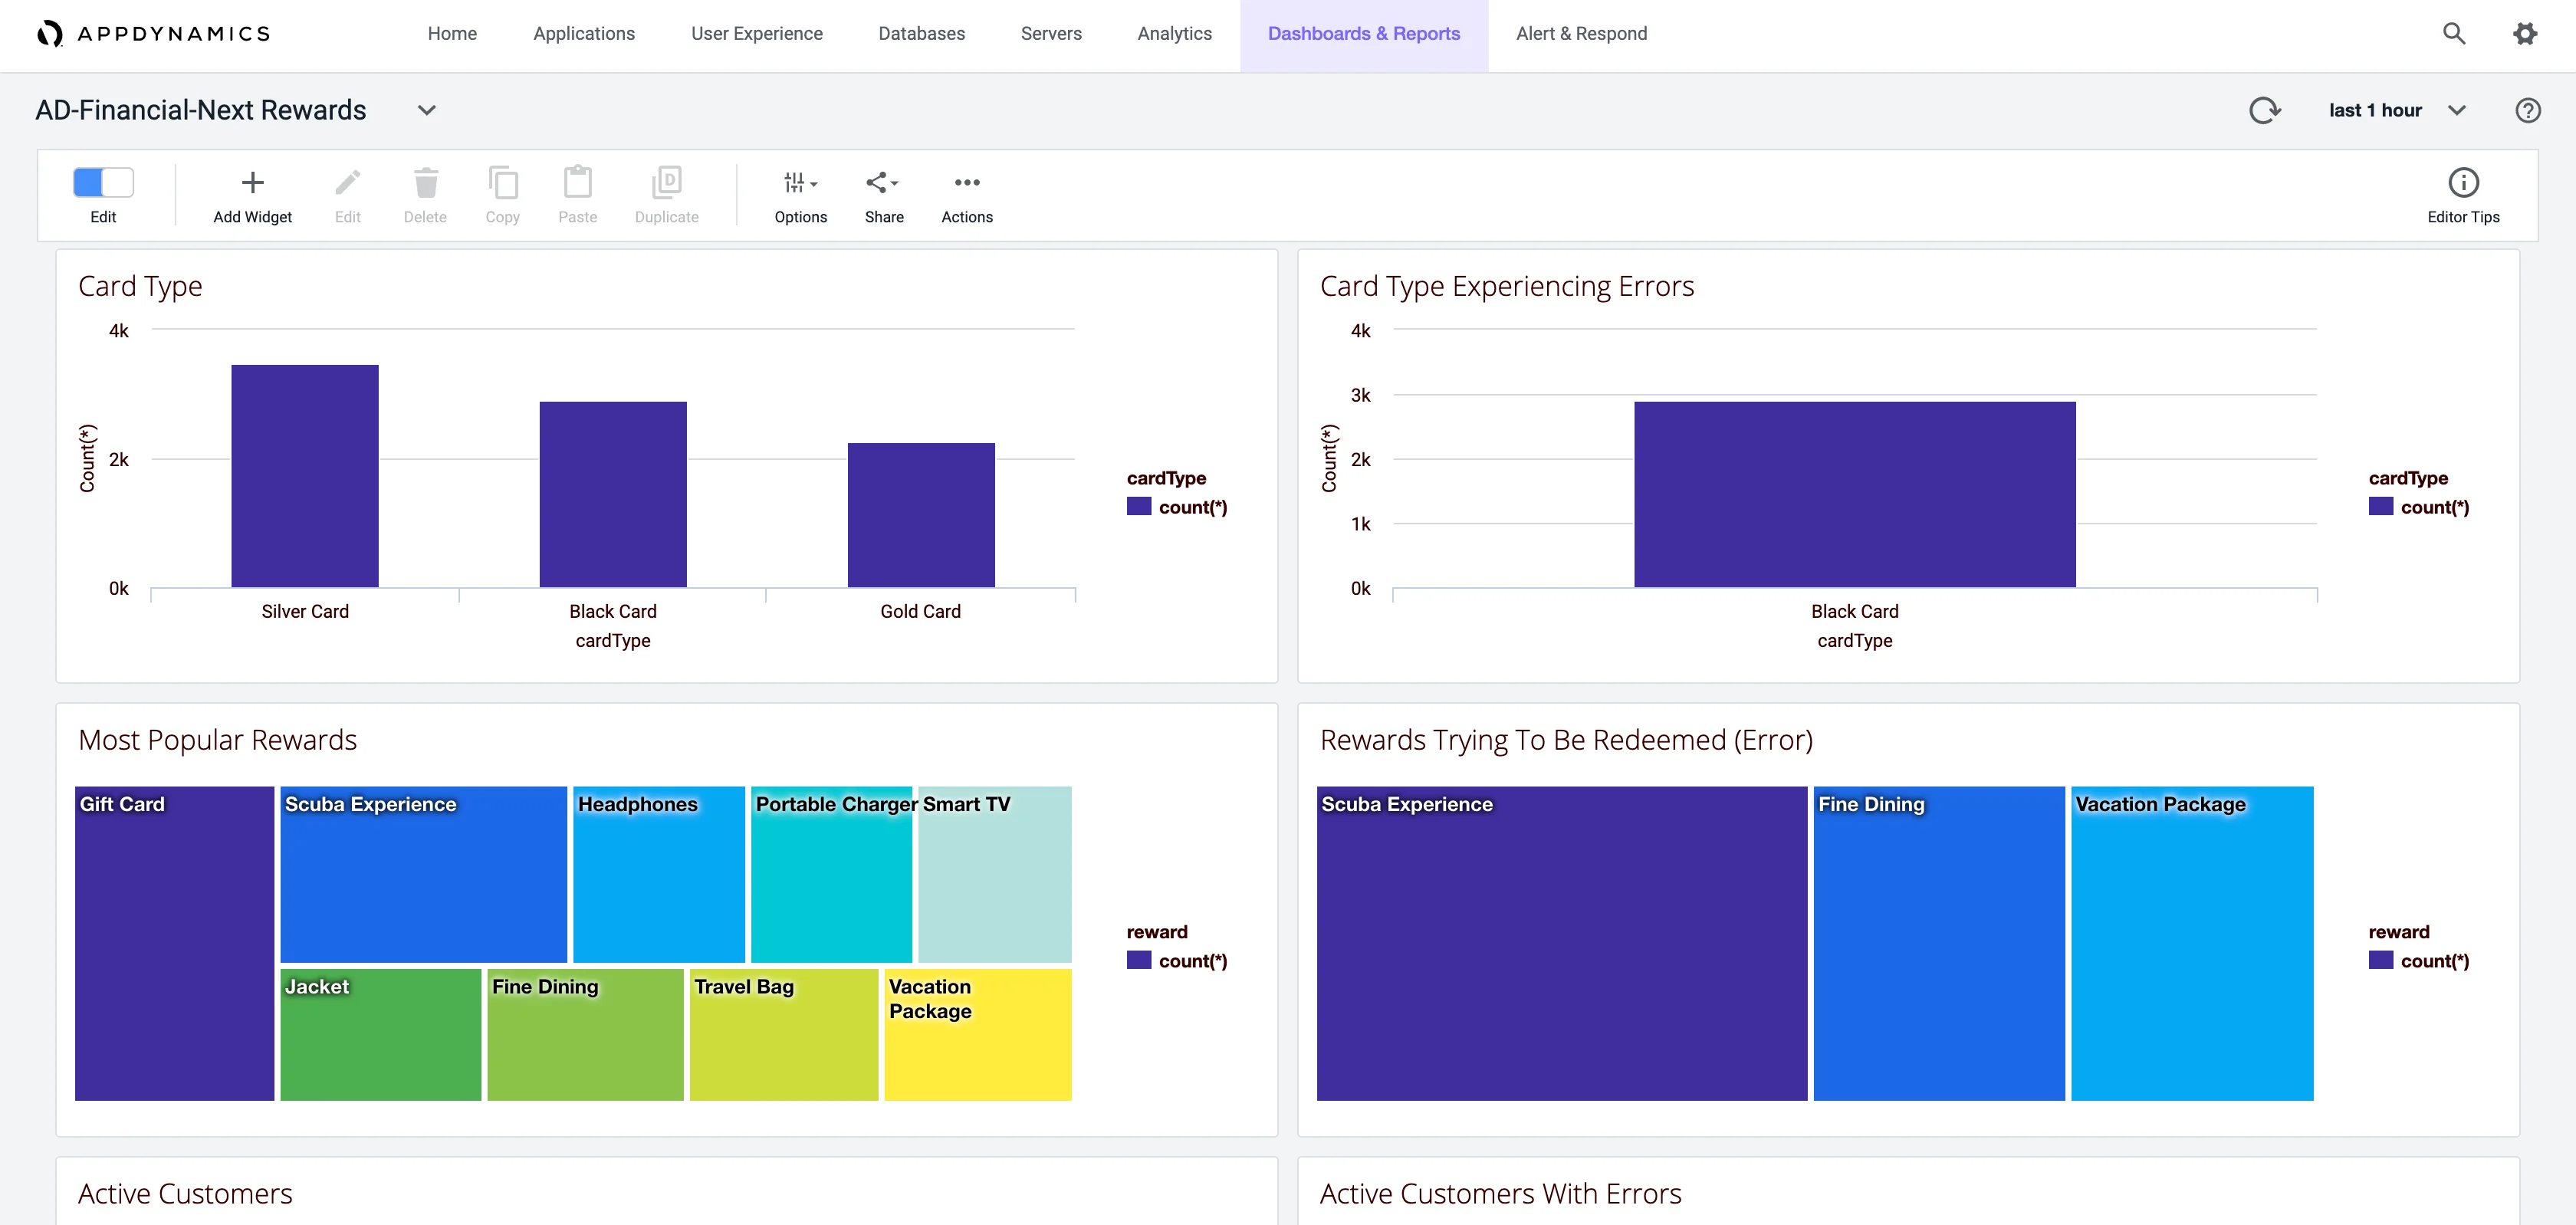
The Analytics home page was redesigned, leading DEM to make common business queries more discoverable.
We also provided a more advanced interface for Analytics users who wished to browse all the data records contributing to a business result.
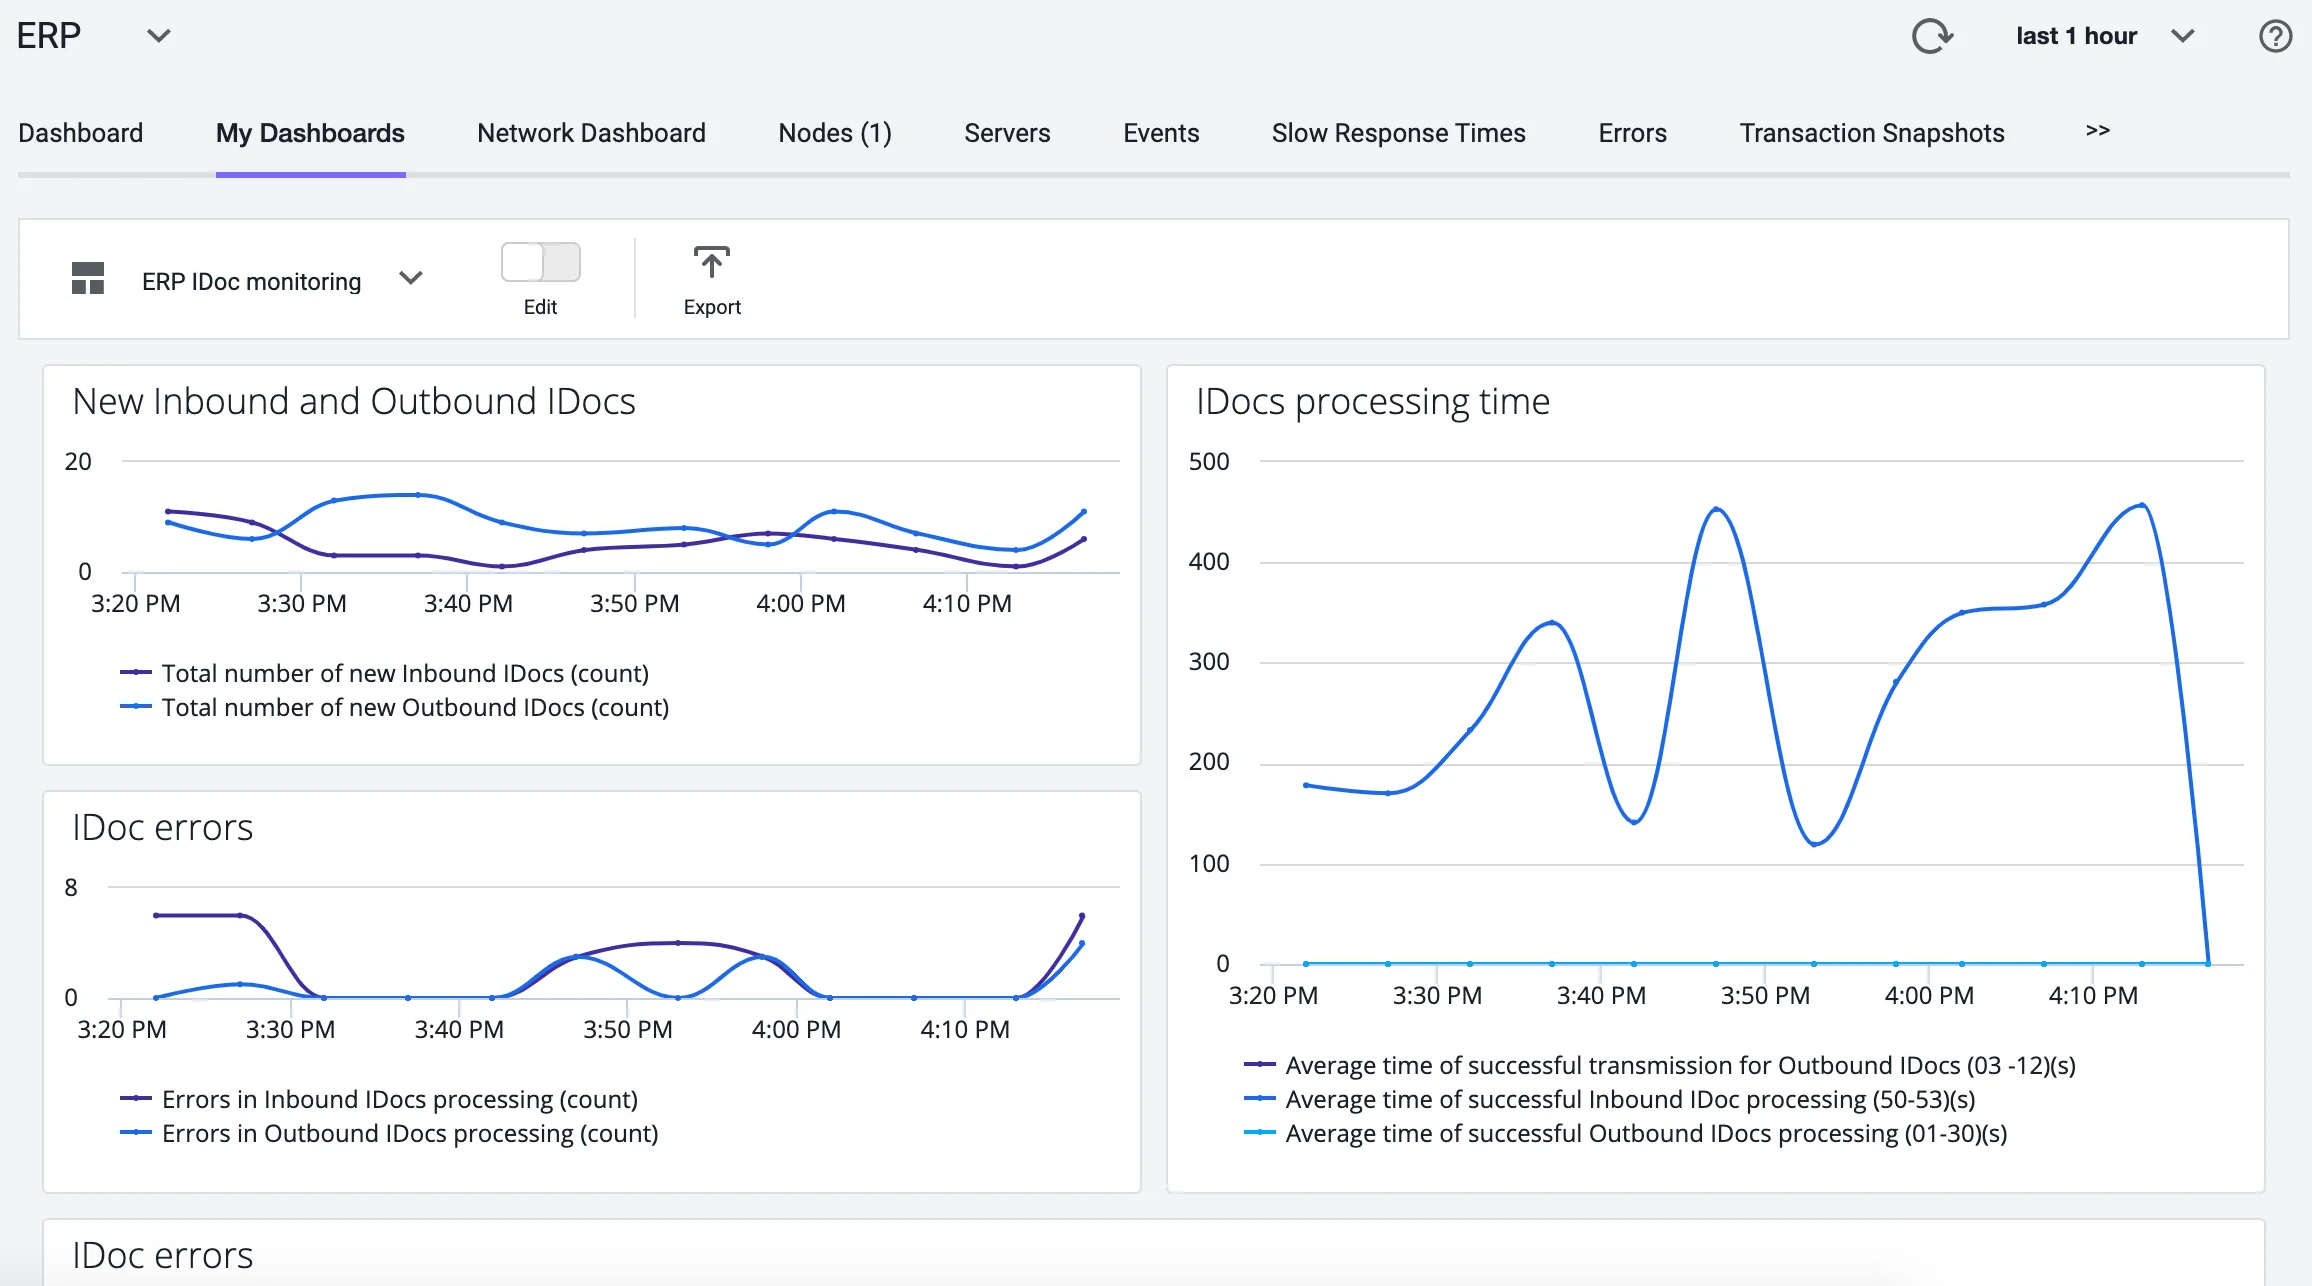
The team launched SAP integration in 2019, opening up the product to large enterprise customers who rely on SAP. AppDynamics lets them visualize their business goals.
Incorporation into AppD Cloud
I was asked in 2020 to take on a leadership role in envisioning the next-generation product of the company, which eventually became AppDynamics Cloud. Due to having to step away from work in 2021 for a major surgery, I handed over that project to another leader and set it up for success. When I returned after the surgery, I stepped back into my role with DEM. AppD Cloud was heavy into its development phase, and the next challenge became figuring out how DEM's capabilities should fit into the long-term roadmap.
I worked with my team of Product Managers to do team-wide roadmap planning for the next generation. We planned out a multi-year roadmap, the fruits of which are now starting to materialize with next-generation business transactions for BiQ that derive data from Cloud Native applications running on Kubernetes and other technologies. I again turned to a RICE-style of priority ranking, but we also thought deeply about how we could bring the DEM capabilities closer into the rest of AppD Cloud to finally realize the vision of starting from the business goals and end user experience and tracing them all the way back to the performance issues from infrastructure and the network.
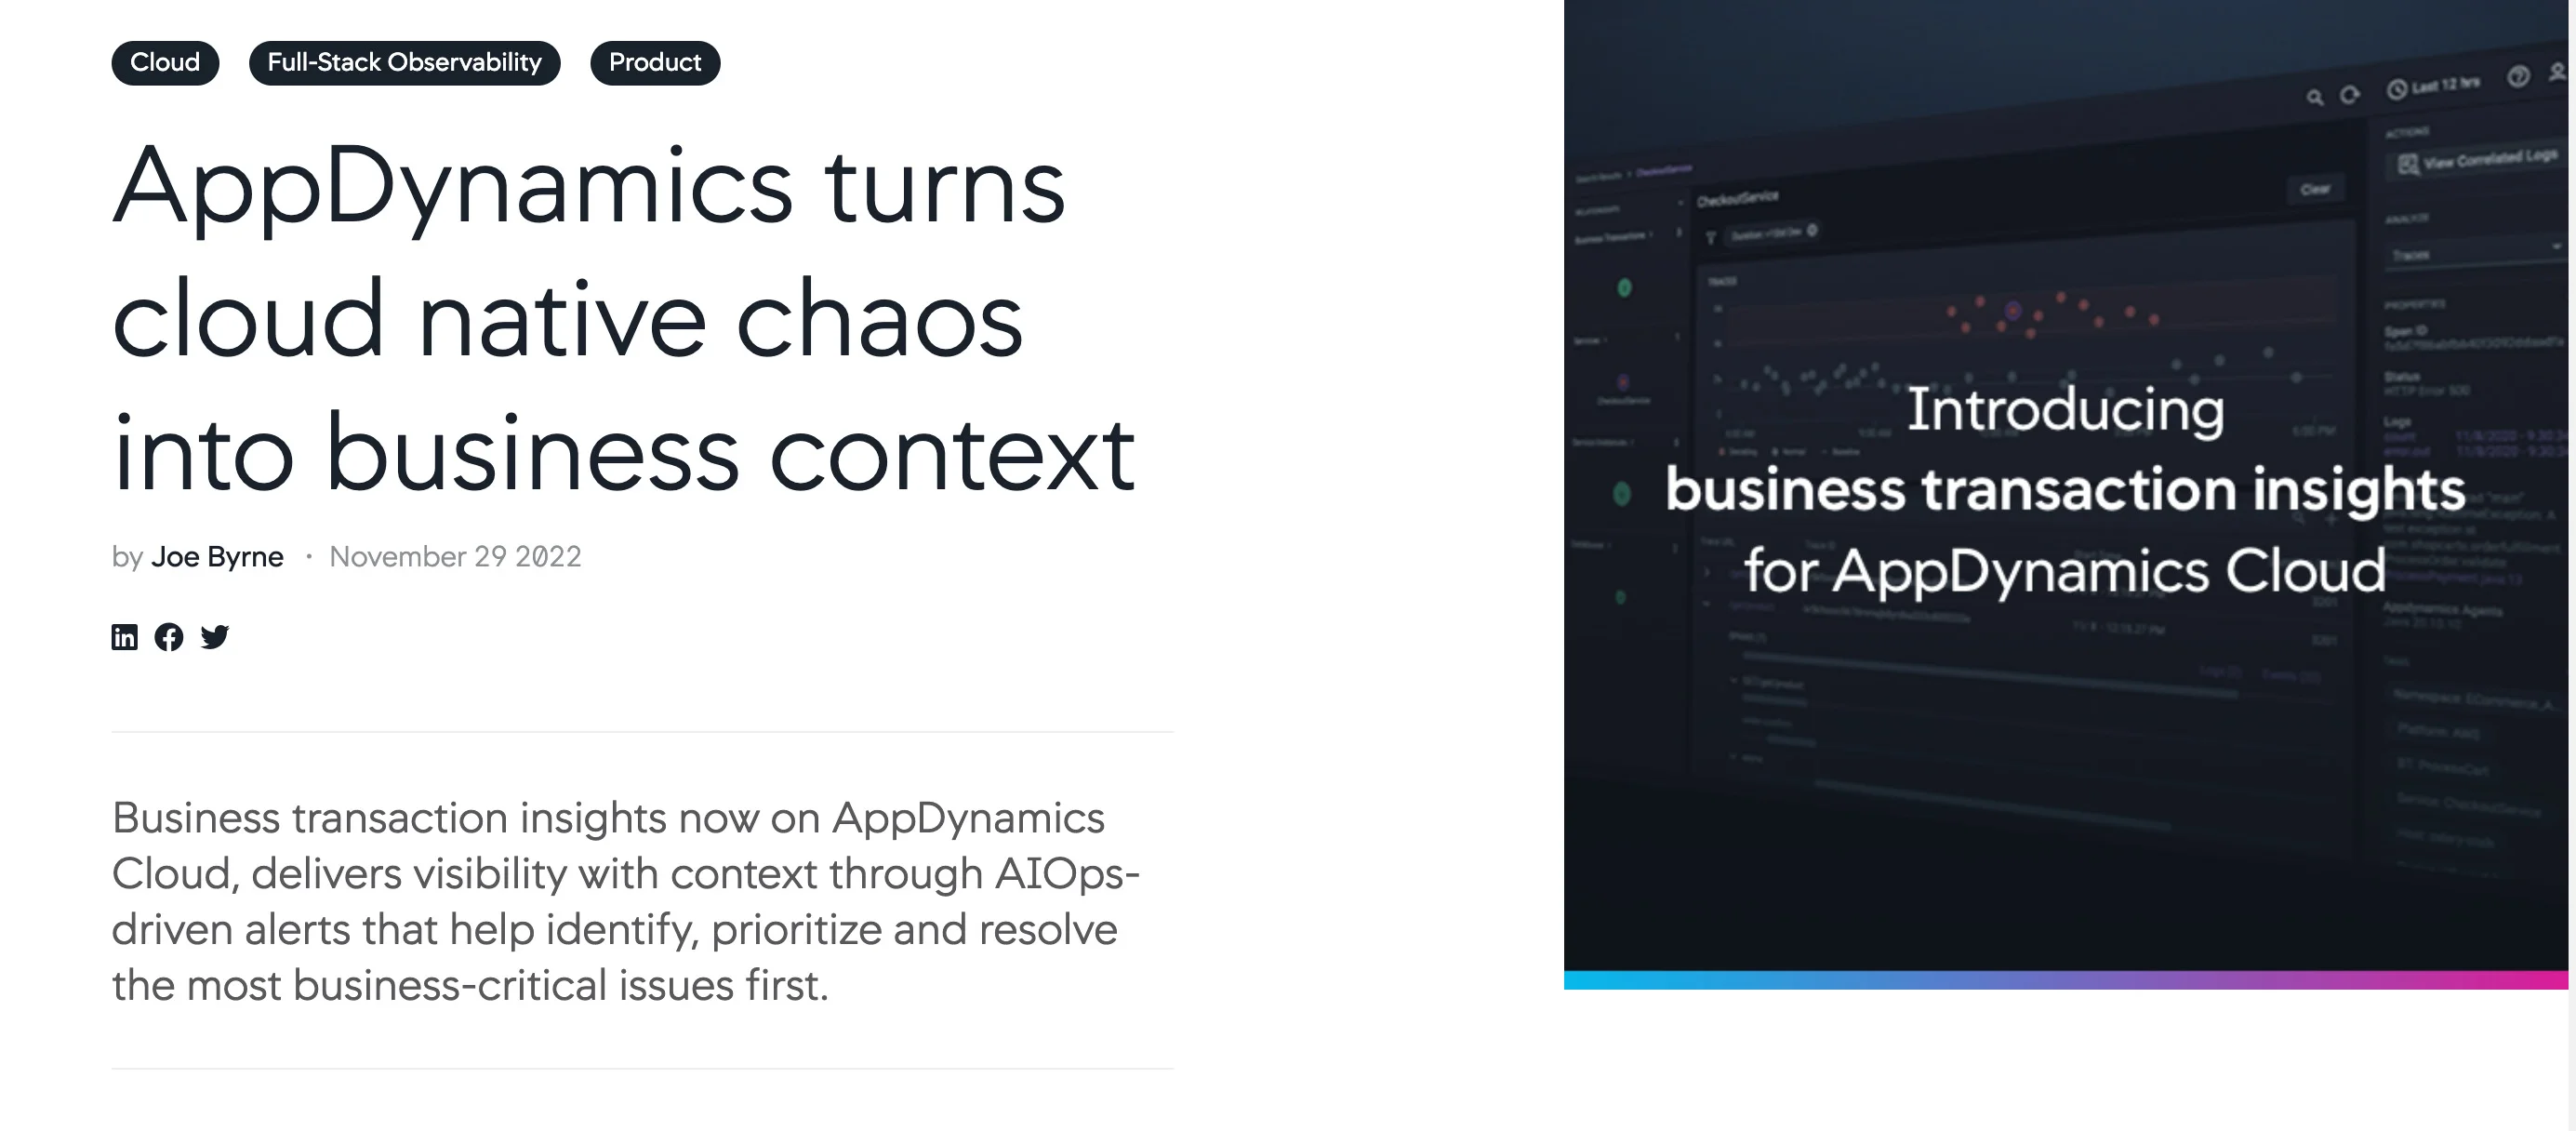
Read more about the launch of Business Transactions, the first step in integrating DEM into AppD Cloud.
Conclusion
I spent several years as the leader of the DEM product at AppD. During this time, we continued to grow the customer base and usage of the product through innovative capabilities like the Experience Journey Map and the introduction of SAP Business Performance Monitoring through BiQ. I led a multi-level organization of 7 Product Managers and even took on the PM role for Analytics for a period of time. I grew a lot during this time and worked hard to recognize and elevate talented people.
Results
- Lead & directed a high-performance team of 7 Product Managers across a portfolio of more than $20MM in yearly services revenue for AppDynamics Digital Experience Monitoring (DEM).
- Crafted product strategy, key KPIs, agile activities, customer-facing roadmaps, and go-to-market strategy for the $10MM Analytics and Business Intelligence products. Grew year over year license consumption by 58% for this critical product line.
- Improved license consumption of Browser and Mobile Real User Monitoring by an average of 35% over two years.
- Built executive support and alleviated technical and design hurdles, thus enabling my team to successfully launch the Experience Journey Map, Analytics improvements, and SAP Business Performance Monitoring.
Key Takeaways
- This was the highest level of responsibility I have had in managing an organization so far in my career. Within a few years of transitioning to Product Management, I had stepped into a role in which I had to mentor and coach people across several teams and manage a large product portfolio. It pushed me to improve my skills rapidly, and I am proud that I was able to effectively steer the ship.
- While I had managed teams before, I learned a lot about navigating difficult conversations with team members and other stakeholders in the company. I applied a lot of what I had learned from the concept of Radical Candor, caring personally about others while not avoiding challenging directly when important changes were needed.
- For a mature product such as DEM, we needed to find ways of continuing to push innovations such as the Experience Journey Map. This needs to be planned into the roadmap early, with full team buy-in. My skills from the design world really helped me encouraged Product Managers to always be talking with users and working with User Researchers to uncover greatness.
Acknowledgments
I want to thank PM team members Emily Wang, Swathi Bhat, Aboubacar Traore, Allvin Muthunayagam, Munindra Nath, Akshit Gupta, Shaiju Kalathil, Bharath Venkat, Sandeep Niwas, and Shantanu Rangnekar. Daniel Erwin, Ian Lin, Cadence Chung, Eric Wienke, and Truc Nguyen were deeply involved from the Design organization. On the Engineering side, I worked closely with Puneet Murgai, Jaideep Padhye, Yin Li, and Max Lin. Our Program Managers were Yolanda Repetto-Logan and Simon Shim.